
Web-based Back-Test Reporting
The Wall Street Warrior website houses your back-tested results. The integrated reporting platform generates reports and organizes them in the order in which you created them. The Back-Test Reports are very informative and give you a look inside the trading system, it's profitability and tradability. This also allows the user to mine the results to find higher probability trading scenarios.
Back-Test Reporting
The back-tests results are held in a database on the Wall Street Warrior website. This allows greater flexibility to the user, as all of the following can easily be accomplished with the Wall Street Warrior Back-Test Reporting Platform:
- View back-tested results
- Compare back-tested results with each other
- Print Out Back-Tested Results
- Use our online data-mining application to find higher probability setups - Learn more about the Wall Street Warrior web-based Data Application here!
- View Trading System Statistics
- Download applicable code to use in the Wall Street Warrior - Coming Soon!
To Learn How to Analyze the Back-Tested Results, click here.
Viewing the Back-Tested Results
Login to the Wall Street Warrior reporting site, using your username / password. Guests can view the results,
but cannot see the methods used in the algorithm to create the back-test. For Guest login use the following link and the
information provided below:
Back-Test Reporting
- Username : GUEST
- Password : WSWguest
Once you are logged into the system, you will see a grid similar to what you see here.
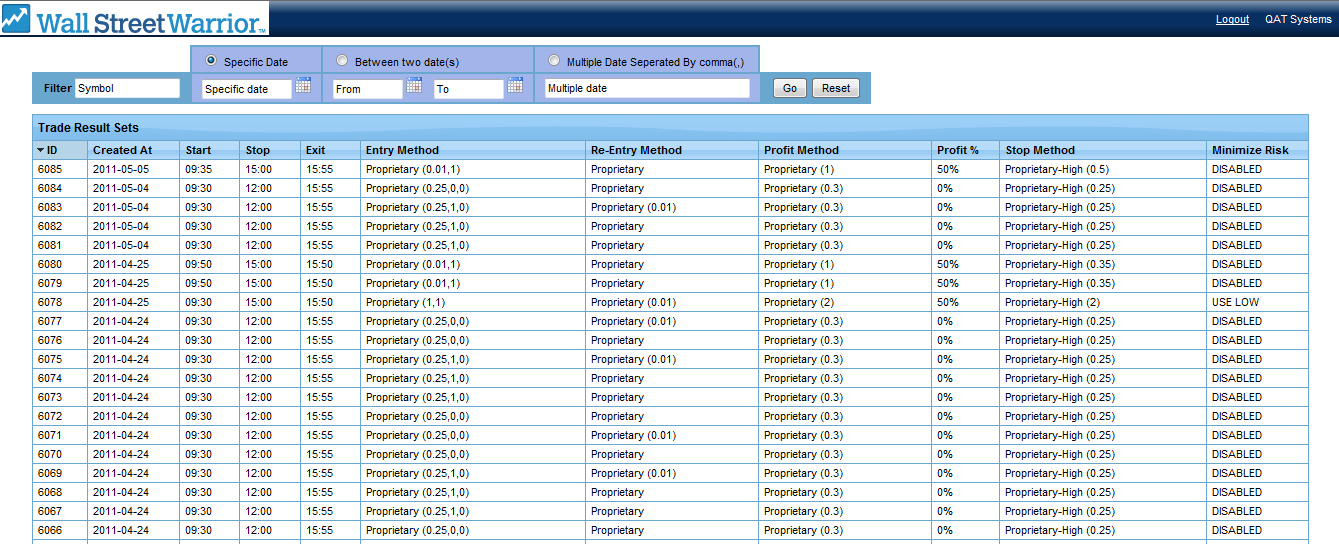
This is a list from all of the back-tests currently in the system and they are listed in chronological order. As soon as another user completes a back-test, it will be shown here. If you login under your username, you will only see the back-tests that you have performed.
Results Set Popup
To view the details of a back-test, you rollover the back-test that you want to analyze. A new window will popup and allow you to select the criteria that you want to analyze.
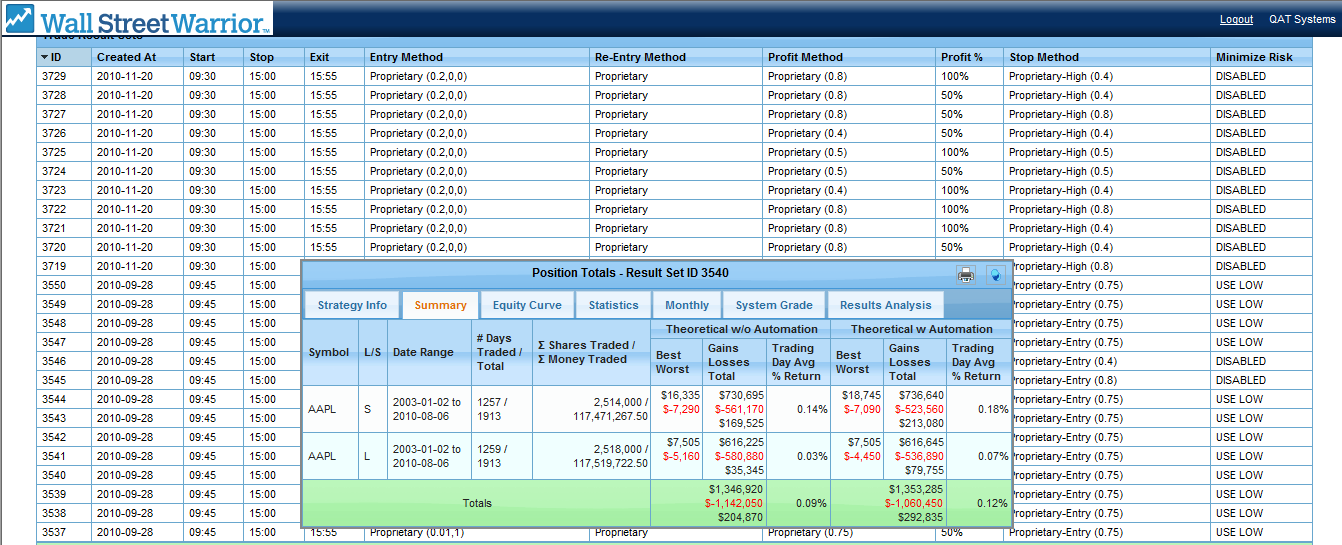
From the results popup you can click on each of the tabs to get a more detailed analysis of the trading system. In the top right corner of the popup, there is a tack, if you pin it down, you can view other results sets. You can also print the entire back-test results summary report by clicking the 'Printer' icon.
Results Set Details
There are currently 5 functioning tabs in the popup window and two more are scheduled to be completed this summer. In the tabs you will find all of the information pertinent to the back-tested results.
- Strategy Info
- Summary
- Equity Curve
- Statistics
- Monthly
- System Grade - Coming Soon!
- Results Analysis - Coming Soon!
Compare Results
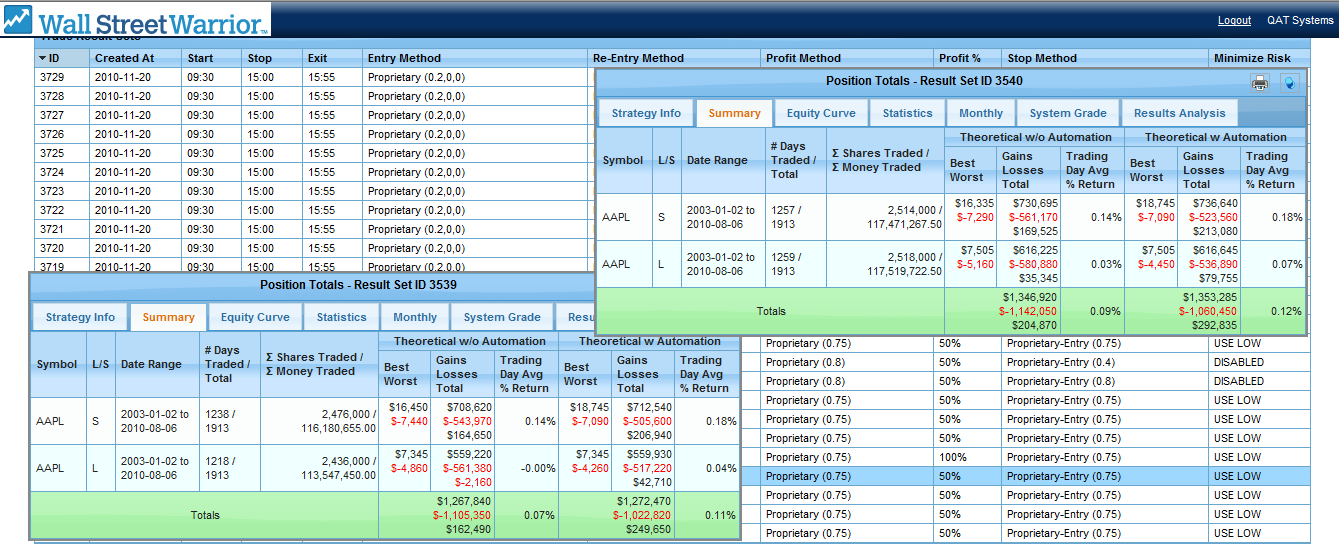
To compare result sets side-by-side, find the first results set, pin it down using the tack in the top right corner. Once the window has been pinned down, you can move it anywhere on the screen. Roll-over another result set and do the same. You can fit approximately 4 results set windows on the screen.
Data Search
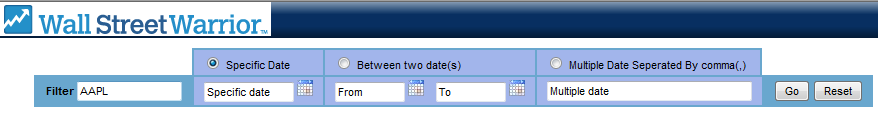
In the Data Search bar at the top left of the screen, you can enter any symbol with a specified range of dates or a list of specified dates and recieve all back-tests for that security during those timeframes. If you want to see all the results for 'AAPL', just enter it in the Symbol area and press the Go button. To learn more about the Wall Street Warrior's Data-Mining Application click here.
Strategy Info
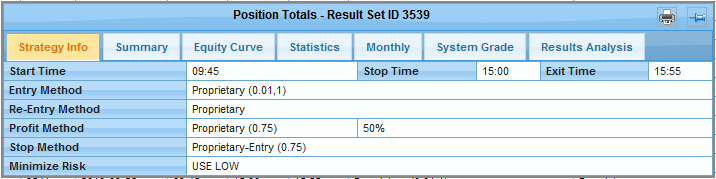
The Strategy Info tab will display the rules used to get the results in the back-test. These rules are entered into the GUI when initializing a back-test using the Wall Street Warrior.
- Start Time - Time to begin trading the Strategies
- Stop Time - Time to Stop Entering Trades
- Exit Time - Time to Exit all Positions
- Entry Method - Method used for entering a New Position
- Re-Entry Method (if used) - Method usded for re-entering a Position after a Stop-Loss
- Profit Target - % Closed Out - Method for taking Profits - % of Position to Close at Profit Target
- Stop Method - Method used for Stop-Loss
- Min Risk On / Off - Minimize Risk turned On or Off - This allows the user to specify that if a New High / Low would generate a smaller loss than the specified Stop, use a break of the high for short positions / low for long positions.
Strategy Summary

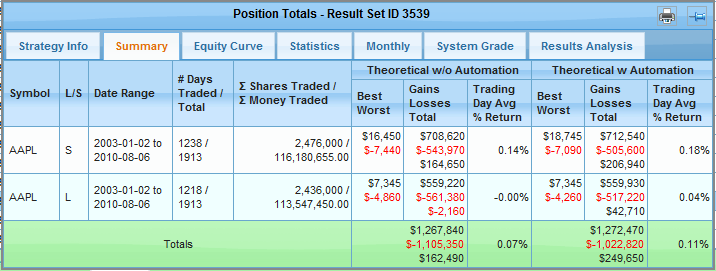
The Strategy Summary tab is a summary of the entire results set for the stock traded and the rules simulated.
- The Sum of Shares Traded is both sides of the Trade, entry and Exit.
- Sum of Money Traded is based on adding up the daily capital spent.
- The difference between Theoretical without Automation and Theoretical with Automation are the way the results are calculated. The Theoretical without Automation assumes that you get the WORST PRICE during the MINUTE that the ENTRY TRADE is executed. Over the Long Term, this is a MASSIVE amount of slippage risk and the stop or profit are NOT adjusted. This is a worst case scenario. Unlike many trading platforms, that illustrate slippage as a best case, we have calculated it as the worst price during the minute of a trade.
- Symbol(s) Simulated
- Long / Short
- Dates Simulated
- Days Traded
- Total Shares Traded / Total Money Traded
- Coming Soon - Avg Capital per Day
- Theoretical without Automation
- Best Trade
- Worst Trade
- Gains / Losses
- Avg Return / Day
- Theoretical with Automation
- Best Trade
- Worst Trade
- Gains / Losses
- Avg Return / Day
Equity Curve
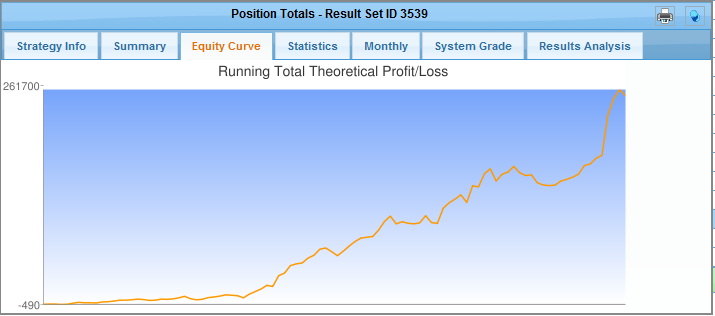
The Equity Curve tab displays a graph of the running PNL total of the Theoretical Automated Trading System. This gives you a visual presentation of how the PNL would look over time. This can help in determining times of strengths as well as weaknesses in the trading system. It can be helpful in showing you what situations will work best, but this can be further examined with the data-mining application.
Strategy Statistics
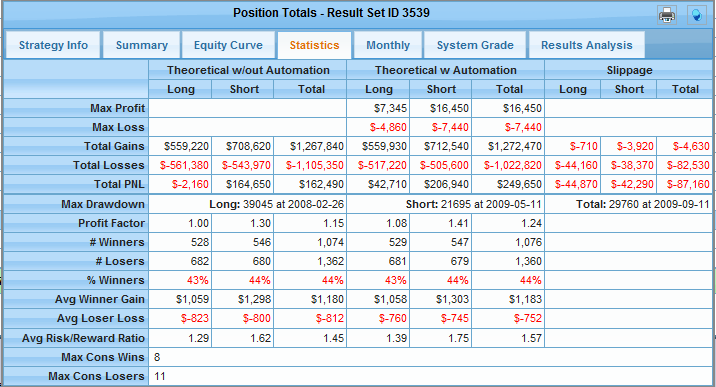
- Max Profit - Max Profit on a Daily Basis
- Max Loss - Max Loss on a Daily Basis
- Total Gains - Total Gains in the back-test
- Total Losses - Total Losses in the back-test
- Total PNL - Combined Gains and Losses
- Max Drawdown
- Long - Max Drawdown when Long
- Short - Max Drawdown when Short
- Combined - Max Drawdown when trading both sides
Monthly PNL
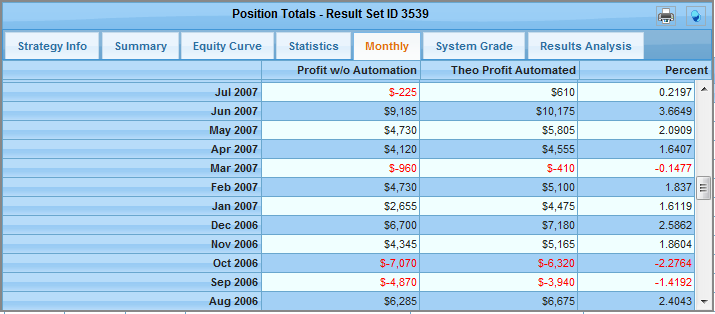
The Monthly PNL breaks down the profit and loss into each individual month over the time period of the Back-Test Result Set. This will also allow you to determine what situations present a profitable trading situation and what situations present losing periods.
System Grade
Coming Soon! - This tab will be able to statistically grade your trading systems.
Results Analysis
Coming Soon! - This tab will mine the results and determine what criteria was met before each winner vs. each loser. This will help you create higher probability trade setups.